Clearly expressed, goals and objectives are essential prerequisites for successful change management in complex environments. System design, implementation, and commissioning in the broadest sense are classic examples of this type of change. The only rational way of measuring the success of complex systems is to assess the degree to which goals have been achieved by measuring the attainment of objectives.
A commonly used mnemonic for defining meaningful goals is S.M.A.R.T. Which depending on who you read can mean many things including:
- Specific Measurable. Acceptable. Realistic. Time Framed
- Specific. Measurable. Attainable. Realistic, Tangible
- Specific. Measurable. Action Plan. Realistic, Timetable
- Specific. Measurable. Action Oriented. Realistic. Time Stamped
Taking a superset of these we get:
- Specific. Measurable, Attainable, Acceptable, Action Oriented, Realistic, Tangible, Time Stamped. Time Framed.
These are all desirable attributes however I feel the S.M.A.R.T. approach confuses goals and objectives, which are actually different things. Furthermore it does not really provide much guidance on how to ensure these desirable attributes are present in any specific goals. I think a more rigorous approach is needed for system design purposes. I use the following framework when defining goals and objectives.
Goals
Goals can often be expressed in just a few words that describe a general aim. Goals are seldom directly measurable. They usually include a desirable quality and, if appropriate, an intended modification to that quality. Examples are: increased customer satisfaction, diversified client base, greater customer knowledge, improved cash flow, reduced hosting costs, improved staff moral, increased systems flexibility, and reduced cost of ownership. Often the goal merely specifies the quality that is to be accentuated, Profitability, Reliability, Maintainability, Security etc.
Objectives
Objectives are tightly bound to goals. Each goal can have one or more associated objectives. Unlike Goals, Objectives are measureable and provide a direct indication that progress is being made towards the goal. By definition the goal is achieved if all its associated objectives are attained. Sometimes objectives represent steps along the way toward achieving the goal and are often called milestones. People commonly define goals without defining supporting objectives, this makes it difficult, and in many cases impossible, to assess whether the goal has been achieved.
Objectives are comprised of 5 parts – Description, Observable Attributes, Test Procedures, Test Values, and Derivation and Authority.
Description
Every objective requires a succinct description that can be used to refer to the objective.
Observable Attribute(s)
Every objective defines a single observable attribute – a parameter, feature, or other characteristic that can be measured and is believed to be a good indicator of the desirable quality described in the goal. For Example; mean-time-between-failure (MTBF) is a common observable attribute for system reliability, days-sold-outstanding (DSO) is often taken as an indicator of client satisfaction and cash flow, and percentage voluntary turnover can be taken as an indicator of staff moral. There are many more commonly used observable attributes and I will try to ennumerate these in another article.
Test Procedure(s)
Every objective has a defined test that can be performed to quantify the observable attribute. The test procedure usually defines the conditions under which the test must be performed. For example; MTBF could be measured over a 6 month period of normal operation commencing 2 months after any significant change to the system, voluntary turnover could be measured every quarter and would exclude employees who were fired and whose total employment was less than 31 days.
Test Values
Each objective has one target value. This is the actual Objective. In addition several other values may be specified for comparative purposes. These are particularly useful when deciding if the target value is achievable and what the cost of achieving it is likely to be. When goals and objectives begin to change as the initiative or project progresses it is by tracking these factors that the system designer is able to stay in control.
- Comparative Values
- Worst Acceptable Value
- Best Achievable Value
- Current Value
- Target Value
- Planned Value
Derivation and Authority
This defines the origin of the objective and is useful when many changing goals and objectives must be managed.
A note on constraints: Constraints are merely objectives not to exceed a specific target value.
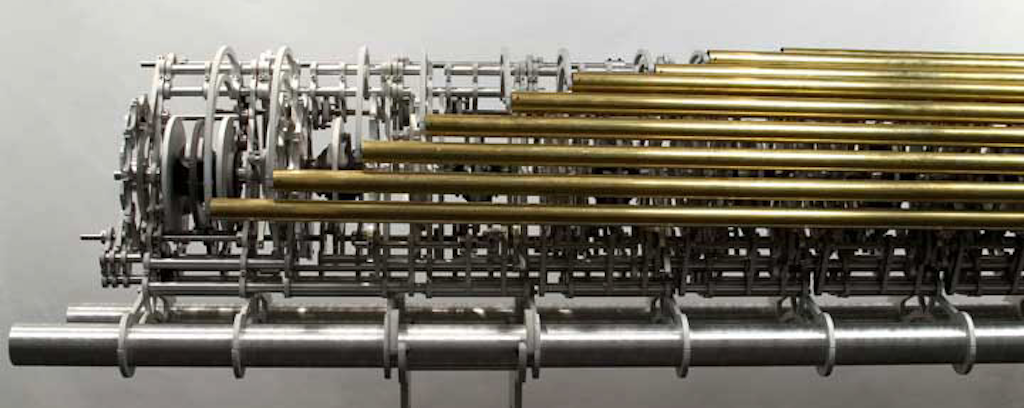
An Extreme Example. The Long Now Foundation‘s 10,000 Year Clock
I like extreme examples because they force us out of the mundane world and make us think about our approach as much as the solution we are designing. And as this article is really about the approach to defining goals and objectives and not a particular solution I think an extreme example is called for. The Long Now Foundation has decided to build a clock of monumental proportions that will operate for 10,000 years. They are entirely serious about this largely symbolic gesture for reasons that I will not go into here.
Below are the principles that Danny Hillis generated to guide the design of the Clock.
- Longevity With occasional maintenance, the clock should reasonably be expected to display the correct time for the next 10,000 years.
- Maintainability The clock should be maintainable with bronze-age technology.
- Transparency It should be possible to determine operational principles of the clock by close inspection.
- Evolvability It should be possible to improve the clock with time.
- Scalability It should be possible to build working models of the clock from table-top to monumental size using the same design.
I believe these are not so much principles as condensed goals and objectives. Below is my attempt to restate these principles as goals and objectives using the framework I have outlined above.
Goal: Operational Longevity
Objective: Display the correct time for 10,000 years assuming occasional maintenance.
Observable Attribute: Difference between the time displayed by the clock and the time determined by another method.
Test Procedure: For 10,000 years after the clock begins operation an observer will examine the clock display at regular intervals of between 1 and 10 years. The examination will last for a reasonable period, not to exceed two days, sunrise to sunrise. The observer must not have access to another timepiece and can only use bronze-age technologies to take measurements. The time must be calculated from first principles without reference to pre-calculated tables or data.
Test Values:
Comparative Value 1: John Harrison (1693 – 1776) constructed a state-of-the-art mechanical clock called H4 between (1755-1759). Now kept at Greenwhich, it lost 5.1 seconds after a 43 day sea voyage in 1761/2. Extrapolating to 10 years gives a loss of 7 to 8 minutes.
Target Value: Difference between displayed time of the clock and time measured by another method is within the experimental error.
I can not find a description of how to calculate time without reference to astronomical tables or specific events such as transits of planets. I imagine it is hard to do with any accuracy in just two days. I would guess that +- 2minutes would be about as good as could be achieved. And even then the observer would need some information such as the latitude and longitude of the clock and the day of the year.
Objective: A reasonable expectation of long-term success assuming occasional maintenance.
Observable Attribute: Fitness of the clock design to support operational longevity
Test Procedure: The design of the clock, its intended housing, construction materials, methods, and location will be inspected by a team of 12 people with expertise in areas such as: the geology and meteorology of the clock location, Time measurement techniques using Bronze age technologies, Bronze Age construction techniques, The Archeology and construction of ancient monuments, Properties of the construction materials, Large scale chronometer construction and maintenance, survival and reliability of cultural institutions over long time periods, Cultural Anthropology, History and Large scale engineering. This team will inspect the design of the clock for a reasonable period and will vote on proposition that “with occasional maintenance, the clock should reasonably be expected to display the correct time for the next 10,000 years.”
Test Values:
Comparative Value 1: With No moving parts Stonehenge has survived for about 5000 years although it evolved over its first two thousand years. The current configuration is only 3500 years old and half of the stones are now missing or fallen. The purpose of Stonehenge is still a mystery but it appears to be some form of calendar.
Comparative Value 2: The Lighthouse of Alexandria , the only one of the seven wonders of the ancient world that was also a functional structure, lasted nearly a thousand years but eventually succumbed to earthquake damage.
Comparative Value 3: The Jingu Shinto Shrine at Ise is rebuilt every twenty years. It was first built in 04 C.E. The Long Now Foundation have identified this Shrine as an example of the kind of tight integration between institution and artifact that they are trying to create.
Target Value: Unanimous vote of confidence in the designs ability to survive 10,000 years and still operate accurately.
Objective: Occasional Preventative Maintenance .
Observable Attribute: Ratio of Expected Lifetime to Maintenance Interval (Mean Time Between Preventative Maintenance) = The number of expected maintenance events
Test Procedure: A 100 year rolling Mean Time Between Required Preventative Maintenance (MTBPM) will be calculated. This will not include repair of clock failures
Test Values:
Comparative Value 1: In her book Longitude Dava Sobel reports that the current curators of John Harrison’s clock H4 believe that if it were kept wound it would require maintenance, consisting of complete disassembly and cleaning , once every 3 years and could be expected to last at least 3 or 4 centuries, although after such a period so many parts would have been replaced due to loss or damage that it could not be considered the same clock. This gives a Lifetime to Maintenance Interval ratio of between 100:1 and 133:1
Comparative Value 2: The highest ratio I can think of for any machine is for an AK-47 which, I am reliable informed, could be expected to last 30 years if cleaned once a week. The remarkable thing about the AK-47 is that it rarely needs cleaning, no matter how badly it is treated. This cleaning regimen would give a Lifetime to Maintenance interval ratio of about 1500:1
Target Value: Lifetime : Maintenance Interval of 500:1 This target value implies a maintenance event every 20 years – Once a generation with enough overlap to support apprenticeship and knowledge transfer. Similar to the Jingu Shinto Shrine mentioned above.
Goal: Maintainability
Objective: The overall complexity of the clock’s design must be within the grasp of Bronze Age Engineers
Observable Attribute: Design complexity must not exceed Bronze Age capabilities
Test Procedure: A panel of 12 engineers from various disciplines should agree that the clock design does not exceed the capabilities of bronze age engineers implied by Bronze Age artifacts and where available contemporary written descriptions of Bronze Age engineering accomplishments.
Test Values:
Comparative Value 1: The Antikythera Mechanism. Built in 87 C.E. on Rhodes and lost in a ship wreak in 76 C.E. off the island of Andikythera was discovered in 1901 by divers. It consisted of a wooden box containing a corroded lump of bronze gears.
It is hard to exaggerate the singularity of this device, or its importance in forcing a complete re-evaluation of what had been believed about technology in the ancient world. For this box contained some 32 gears, assembled into a mechanism that accurately reproduced the motion of the sun and the moon against the background of fixed stars, with a differential giving their relative position and hence the phases of the moon. It is enough to know that there is no trace of anything like it until around 1000 A.D., and that when it was first published there were serious suggestions that it had been dropped into the wreck at a much later date or even that it was the work of alien astronauts.
Bill Casselmann
The Mathematician E. Christopher Zeeman claims The Antikythera Mechanism is an accurate model to 1 part in 40,000.
The existence of The Antikythera Mechanism implies that tantalizing ancient reports of more complex devices on Rhodes 2000 years ago may well be true. Although none is known to have survived.
Target Value: Unanimous vote of confidence that the clock’s design does not exceed the capabilities of bronze age engineers.
Objective: All parts must be within Bronze Age manufacturing capabilities.
Observable Attribute: Part dimension tolerances
Test Procedure:
A panel of 12 engineers must agree that the design of the clock does not require parts to be manufactured to tolerances beyond those achievable with Bronze Age technologies.
Test Values:
Comparative Value 1: The Antikythera Mechanism. Graduation marks etched on the a dial of device show an error of 0.25 degrees in a 45 degree line
Comparative Value 2: Charles Babbage’s Difference Engine No 1. In His book The Difference Engine. Charles Babbage and the quest to build the first computer Doron Swade states that measurements of the handmade parts from Difference Engine No1 established that Babbage’s engineer Clement was able to make repeat parts that differed from each other by no more than two thousandths of an inch. Obviously Babbage’s techniques were beyond Bronze Age capabilities however they are about the limit of what can be hand made.
Target Value: A unanimous vote that no parts tolerance is required by the design to exceed two thousandths of an inch.
Goal: Transparency
Objective: During reassembly the relative positioning and exact orientation of each part must be self evident.
Observable Attribute: Correct operation for 30 days (one lunar cycle) after reassembly.
Test Procedure
A mechanically competent person with no knowledge of the clocks design, applying only bronze age techniques, will attempt to assemble it from it’s component parts with no written or spoken instructions.
Test Values:
Comparative Value 1: Doron Swade reports that. Charles Babbage‘s designs for the Difference engine showed all the thousands of parts in their correct position relative to each other but gave no indication as to how they were to be physically oriented during assembly so their motions harmonized with the rest of the mechanism. When the engine was finally constructed it took many attempts to get all the parts in their correct orientation. Most of these attempts ended in a mechanism jam.
Target Value: The clock can be correctly reassembled from its component parts in less than a day.
Objective: The mechanism must support diagnosis of problems
Observable Attribute: Mean time to diagnose a problem
Test Procedure
Any mechanically competent person who is also able to correctly reassemble the clock from its component parts should be able to identify the source of any operational problem by inspection alone. This ability will be tested by introducing various problems into a working model of the clock and measuring the mean time to diagnose the cause.
Test Values:
Comparative Value 1: When the Difference Engine in the Science Museum, London jams it is almost impossible to diagnose where the jam has occurred. “There is no easy way of isolating one section of the engine from another so as to localize the source of the jam” All a hapless engineer can do is to poke around with a screwdriver.” The engines design lacks any way of localizing an error to a small section of the clock and identifying the problem without disassembly.
Target Value: The mean time to diagnose the cause of a problem and shall not exceed 15 minutes from problem identification. (Fixing it may take considerably longer!)
Objective: The procedure for resetting and restarting the clock must be intuitive.
Observable Attribute: Mean time to reset and restart
Test Procedure:
Any mechanically competent person should be capable of resetting and restarting the clock if it is stopped.(How they know what time to set it to is their problem!)
Test Values:
Comparative Value 1:
Target Value: The mean time to reset and restart the clock shall not exceed 30 minutes from problem identification.
Target Value: The mean time to reset and restart the clock shall not exceed 15 minutes.
Goal: Evolvability
Objective: The clock must be modular in design.
Observable Attribute: The mechanism must comprise many loosely coupled modules that can each be replaced with other modules that perform the same function but are of a different design.
Test Procedure: Functionally identical modules of different design will be constructed and switched between different model clocks.
Test Values:
Comparative Value 1: The Salisbury Cathedral Clock was installed in 1386 It has no face and only strikes the hours. It originally used a foliot balance with a verge escapement. At the end of the 17th century, these were replaced by a pendulum and a recoil escapement. Holes on the clock’s frame show that these were later replaced again. In 1884, a new clock was installed and the old one was forgotten. In 1956, the clock was restored to its original condition and made to work again. Its pendulum and recoil escapement were replaced by a new foliot balance and verge escapement.
Target Value: Each module of the clock should have two completely different designs that are interchangeable leading to 2 to the power n different configurations of the clock, where n is the number of modules.
Goal: Scalability
Objective: It must be possible to build a working model of the clock over a large range of sizes.
Observable AttributeSize of different versions of the clock
Comparative Value 1: 1/30th scale Corliss steam engine. Jerry Kieffer, a field representative for a Wisconsin power company managed to construct a working 1/30 scale Corliss steam engine model (1.5 orders of magnitude). This involved constructing miniature .009″ diameter hex bolts and matching nuts for use on the model. Every part of the model was to scale although some of the model parts were not made of the same material as the original engine.
Comparative Value 2: The great clock in the tower of the Place of Westminster, London, commonly known as Big Ben, was the largest clock ever built when it was installed. However size brings it’s own problems namely momentum which increases with the cube of distance. When one part of the mechanism failed in 1976 it took a year to repair the extensive damage.
At 3:45am on the 5th of August 1976 as the clock started to chime, metal fatigue in the shaft connecting the chiming train to its fly fan caused the shaft to break. Without the retarding and braking effect of the fly, the chiming mechanism, propelled by the 1.25 ton weight in the shaft, increased its speed of rotation dramatically. This led to the total destruction of the chiming mechanism, with various components and fragments of others being scattered about the clockroom. Some pieces of machinery were flung at the ceiling with sufficient force to penetrate to the room above. The cast iron frame was fractured and collapsed onto the winding motor below. The flying debris also caused damage to the going and striking trains.
It was necessary for the chiming train to be reconstructed from scratch. The magnitude of this task meant that other options, such as replacement with an electric motor, were considered. The reconstruction took almost one year to complete.
Target Value: The clock design must allow working models that scale over 2 orders of magnitude (1 to 100 meters)
Conclusions
In thinking about the 10,000 year clock I have come to several conclusions;
Bronze Age technology was more advanced than I ever knew. There appears to be one issue that Danny Hillis did not address in his principles. If the clock survives it could well become a victim of it’s own success. John Harrison’s H4 has become an historic object and is now considered too important to be wound. The “evolution” of Salisbury Cathedral’s clock has been reversed by removing the pendulum and recoil escapement, added to improve the clocks time keeping, and replacing it with a foliot balance with a verge escapement, thus “restoring” the clock to its original configuration. It would be a shame if The 10,000 year Clock of the Long Now were to survive only to be stopped to “preserve” it for future generations. Paradoxically it may be worth deliberately designing all the clocks parts to wear out and be replaced before they can become historic artifacts in their own right.