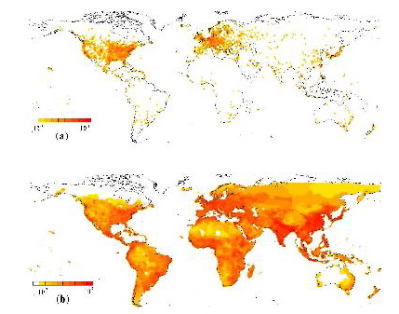
- (Top) Worldwide router density map obtained using NetGeo tool to identify the geographical location of 228,265 routers mapped out by the extensive router level mapping effort of Govindan and Tangmunarunkit.
- (Bottom) Population density map based on the CIESIN’s population data. Both maps are shown using a box resolution of 1 degree by 1 degree.
- The bar next to each map gives the range of values encoded by the color code, indicating that the highest population density within this resolution is of the order 10^7 people/box, while the highest router density is of the order of 10^4 routers/box. Note that while in economically developed nations there are visibly strong correlations between population and router density, in the rest of the world Internet access is sparse, limited to urban areas characterized by population density peaks.
This graph and the explanation above are taken from Modeling the Internet’s Large-Scale Topology by Soon-Hyung Yook, Hawoong Jeong, Albert-Laszlo Barabasi. Department of Physics, University of Notre Dame, Notre Dame, IN 46556, USA.
The authors state that the performance of Internet protocols is greatly influenced by network topology. It is therefore important to build accurate models of the Internet in order to test new protocol designs. This paper explains their findings about the large-scale structure of the Internet. They document several significant findings that contradict existing models:-
- The distribution of nodes on the internet is fractal and is strongly correlated with the fractal distribution of humanity. In the past the distribution was thought to be random.
- The likelihood of two nodes being linked decays linearly in proportion to the distance between them. In many existing models this likelihood was thought to decay exponentially as the distance between nodes increased.
- Preferential attachment is the name for the process by which scale free networks are thought to grow. It assumes the probability that a new node will link to an existing node is related to the number of links the existing node already has. The results indicate that the rate at which a node increases its degree is linearly proportional to the number of links the node has.
- The Authors then describe a mathematical model built on these findings and point out that the existing models of the internet do not fit well with their findings and are therefore of limited value.
This is great but I think the authors have missed the economic side of things. The graphs clearly show the Internet is related to population density but I would guess it is more closely related to wealth density. If a map of the earth could be drawn with 1 degree by 1 degree squares color coded by the product of GDP per capita and population density I think it would look much more like the Router density map than the population density map does. Some of the graphs I produced in this article hint at this kind of distribution. I think using a wealth density approach would link Internet growth to the ecomony and provide a much better model.